From response
to understanding.
Capture a chart or import measured data. Review the curve, identify the process, and compare controller tunings in one workspace.
From your test to a controller you can review.
Explore the three steps. Your data stays at the center of every decision.
Your process test, ready to analyze.
Load a chart image or measured data. Pick the response curve, check the axis readings, and set the time unit before you use the trace.
- Import a file, capture a screen, or paste an image.
- Review detected values and correct them when needed.
Keep the important decisions visible.
Move from image extraction to model comparison without losing the evidence behind a controller recommendation.
Explore the guideFrom chart image to controller tuning
Follow image upload, frame adjustment, axis review, trace confirmation and analysis step by step. Download the example chart to work through it yourself.
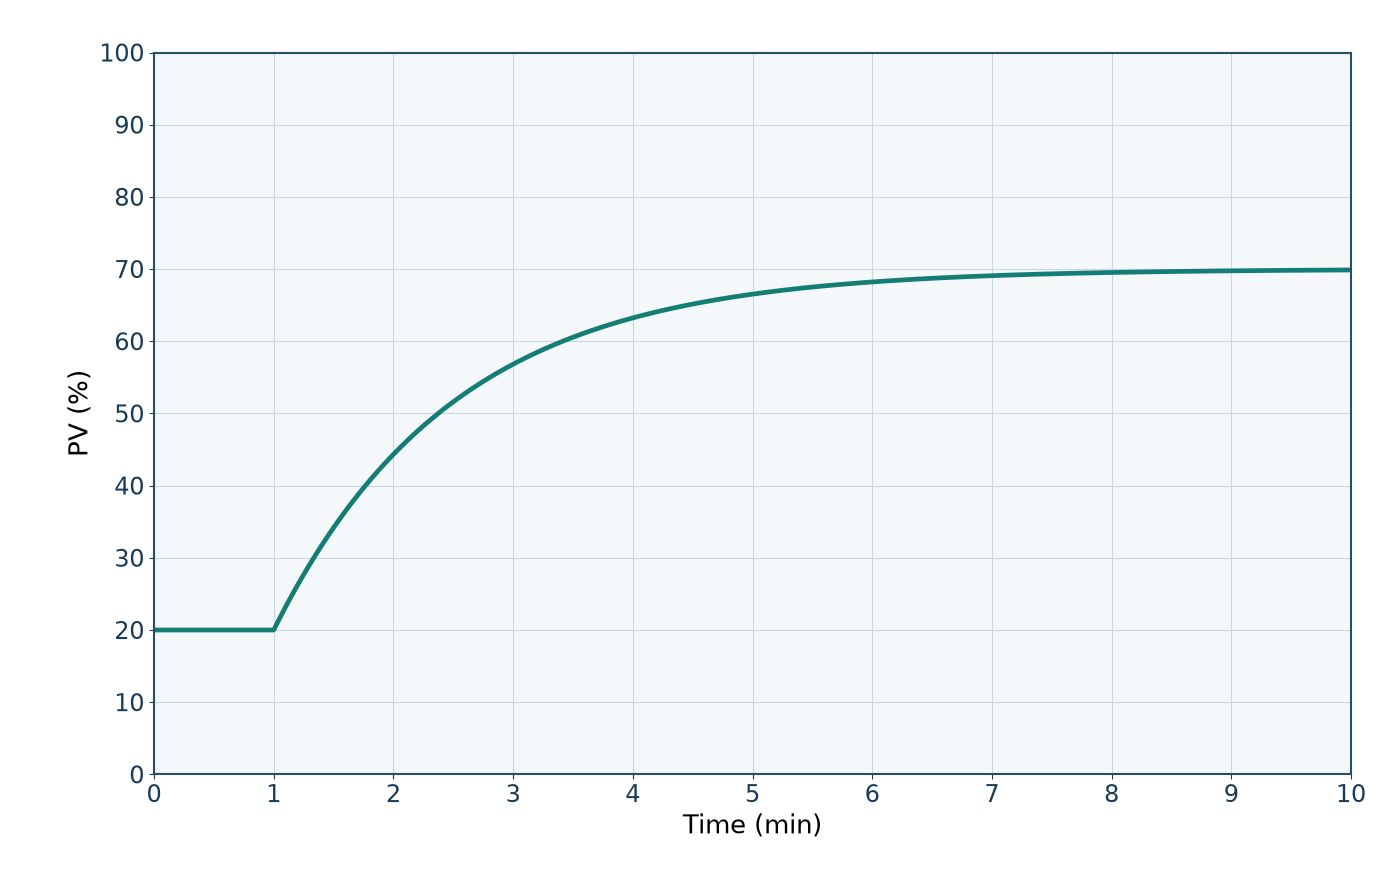
Read the steps
- Load the image
Open Auto Analyze, choose Load photo, and select the example chart. Keep its axis labels visible.
- Adjust the frame
Drag frame edges or corners to cover the plot. Reset frame restores the detected area. Zoom and pan help inspect it; Fit image restores the view.
- Pick the curve
Choose Pick curve and click the intended line. Inspect the extracted overlay; it should follow that line and include its beginning and end.
- Review the axes
Compare all four limits with the chart labels. Correct any mismatch. If OCR is unreliable, use detailed OCR or enter the limits manually.
- Confirm the trace
Keep Store trace as on PV for this open-loop example. Choose Use selected trace, then open Reviewed signals and inspect the converted data.
- Configure the test
Check the variable, MV step, calibration and time unit. Review detected behavior and compatible models. Reconfirm the image trace after calibration or time changes.
- Review and run
Open Review Selection. Verify the checklist and source response, choose Run analysis, then confirm Start analysis. Calculation waits are shortened in this tutorial.
- Compare results
Inspect the model equation and fit. Open Controller comparison, compare response curves, and choose Tune this controller on the tuning you want to inspect.
- Tune and evaluate
Drag Kc to see the simulated response change. Evaluate response performs the full check. Here, higher gain increases overshoot; Reset restores the recommendation.
- Export and reopen
Use Export report to keep the result. History reopens saved results; Review saved image restores this chart on the same browser when its local cache is available.
Ready to review your next process test?
Create an account, then bring a chart or measured data into TUNAI.